
-
3 years ago
-

0
-

The Rectangle Pattern
Introduction
The rectangle is a classical trading pattern marked by horizontal lines showing significant support and resistance. Support refers to any price point below the current market price where buying emerges to create, at least temporarily, a pause in a downtrend. When the price is above the current market price where selling causes, at least temporarily, a pause in an uptrend, it shows resistance.
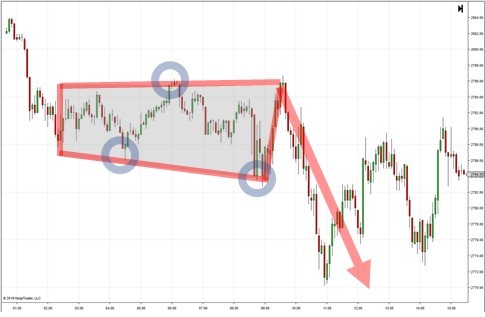
This pattern, therefore, forms when there is a pause in the trend. The rectangle can be easily identified by two comparable highs and two comparable lows. These highs and lows can be connected to form two parallel lines, which constitute the top and bottom of a rectangle.
Generally, the trending prices pause during this time and the price moves upwards and downwards indecisively between the top band (the resistance) and bottom band (support) of the rectangle. The pattern may be formed following an uptrend or a decline.
Rectangles are typically a continuation pattern and the price is expected to break out of the rectangle in the direction of the original trend. You can successfully trade a rectangle by buying at support and selling at resistance or by waiting for a breakout and using the measuring principle.
Description of the Pattern
Unlike any other chart pattern, the highs and lows of a rectangle remain nearly at the same levels. This shows that neither bulls nor bears have a winning hand. The trend is simply at a pause, with the bullish and bearish sentiments balancing each other without any side winning.
Bearish and Bullish Rectangles
If the trend before the formation of the rectangle is bearish and the price breaks out in the same direction, the pattern is called a bearish rectangle. However, if the rectangle forms during an uptrend and price breaks out to the upside, the pattern is a bullish rectangle.
Reversal or Continuation Formation
The rectangle can serve as either a reversal or continuation formation. As a reversal pattern, it ends a trend either upwards or downwards. As a continuation pattern, it marks a pause in the prevailing trend, with the expectation that the previous trend will eventually resume. In both the cases, the rectangle displays a tug of war between buyers and sellers.
Supply and Demand in Balance
The rectangle typically shows the supply and demand in balance. The stock price can move in a narrow range over a long period, meeting resistance at the rectangle’s top and finding support at its bottom. Alternatively, the rectangle may form quickly amidst a wide–ranging series of fluctuations. It is essentially a pattern which shows trader indecision, where the bulls and bears are nearly equally powerful.
Trading the Rectangle Formation
For trading this pattern, you need to firstly identify a rectangle on the chart, spot a rectangle breakout and then enter a rectangle trade in the direction of the breakout. You may then want to put a stop loss in the middle of the rectangular range and remain in the trade until the price action completes the pattern for at least one time. You can opt for further profit if the price action rules permit.
Indicators
It is a good idea to stay in the bullish rectangle trade as long as the price action creates ascending bottoms. You want to close the trade when the price action confirms both declining tops and bottoms.
Likewise, you want to remain in the bearish rectangle trade as long as the price action causes descending tops. Close the trade when the price shows both ascending tops and bottoms.
Conclusion
The rectangle, therefore, displays a period of consolidation or indecision between buyers and sellers when they both try to overtake one another but neither succeed. It pits the bulls against the bears in the trading range.
As the stock price nears support, buyers step in and make the price rise higher. Again, as the price nears resistance, bears take over and push the price lower. Ultimately, one party (either bulls or bears) exhausts itself and there is a winner at the time of breakout. It is noteworthy that rectangles are basically neutral. The price action shows a market that is in conflict even though guesses are possible at times from the volume patterns. It is only when the price breaks above resistance or below support that it becomes clear which party has won.
Reference Links:
https://www.investopedia.com/articles/trading/08/rectangle–formation.asp
https://www.babypips.com/learn/forex/rectangles
https://tradingsim.com/blog/rectangle–pattern/
http://www.forexabode.com/forex–school/watch–out–for–patterns/rectangles/
https://learn.tradimo.com/advanced–chart–patterns/bullish–rectangle
Browse Categories
Featured Posts
 3 years ago
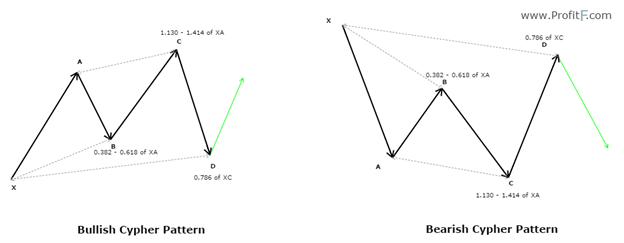
Cypher Pattern
 3 years ago
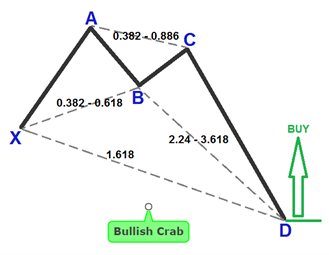
Crab Pattern
 3 years ago
Butterfly Pattern
 3 years ago
Bat Pattern
 3 years ago
ABCD Pattern
3 years ago
The Rectangle Pattern
 3 years ago
Triangle Patterns
 3 years ago
Flag Pattern
 3 years ago
Double and Triple Pattern
 3 years ago
The Cup with Handle Pattern
 3 years ago
The Head-and-Shoulders Pattern
Popular Posts
Litecoin
3 years agoTape Reading Origins
3 years ago
The Head-and-Shoulders Pattern
3 years ago